
In the world of mathematics education, once courses are way ahead of basic concepts like addition and subtraction or fractions and decimals, educational materials often sacrifice visuals for more “advanced” resources. However, the visual side of math is extremely important at any grade level.
The intersection of visual learning and mathematical proficiency is particularly evident in areas such as data science and engineering, where the ability to interpret and visualize data is paramount.
This blog post delves into why visual math is not just beneficial but essential at all educational levels. We will explore how visual math can boost engagement, improve performance, and prepare students for real-world applications. Additionally, we’ll provide practical tips for incorporating visual elements into your math curriculum and highlight how tools like Sowiso can support these efforts.
Why is visual math relevant?
Research shows that powerful learning occurs when different brain areas are engaged. Park and Brannon (2013) found that symbolic (e.g., numbers) and visual-spatial (e.g., arrays of dots) information are processed in different parts of the brain. Math learning improves when these areas communicate and students use both kinds of information together. Training students with visual representations significantly enhances their math skills, even in numerical tasks.
Jo Boaler, a professor at Stanford Graduate School of Education, advocates teaching math in more visual ways and encouraging a more playful and flexible attitude (Standford Report, 2024). She argues that math is often taught using abstract symbols and numbers, but integrating visual and physical models can enhance understanding. According to her, when middle-school students construct a 4x4x4 cube using sugar cubes, they gain a deeper understanding of geometry than they would by simply working with numbers. This hands-on experience helps them develop mental models that stay with them.
Unfortunately, following Boaler, as students progress to higher levels, these tangible, visual methods are often replaced by purely symbolic approaches. However, visual thinking remains crucial in fields like engineering, suggesting that maintaining visual and physical interactions with math could benefit learners of all ages.

Benefits of visual math teaching and learning
Boost students’ engagement
Grabbing and maintaining students’ attention is one of the main challenges mathematics teachers face at any grade level. Visual math teaching can be more engaging than traditional methods. By incorporating graphs, interactive simulations, and dynamic visual aids, students become more interested and motivated to learn.
This increased engagement often leads to greater participation in class discussions and activities, fostering a more active and collaborative learning environment.
Improve students’ math performance
Integrating visual elements into different mathematics tasks helps students grasp complex concepts more easily. Visual representations can demystify difficult topics, allowing students to build a stronger foundation. As a result, students might show improved performance on assessments and a better overall understanding of mathematical principles.
Foster a deeper understanding of mathematics
Visual math aids in bridging the gap between abstract ideas and practical applications. By seeing math facts visually, students can better comprehend how different concepts are interconnected. This deeper understanding enables them to apply their knowledge in various contexts, enhancing their ability to think critically and solve real-world problems.
Provide students with tools to solve complex problems
Visual math equips students with fundamental tools to tackle complex problems efficiently and enhance their problem-solving abilities. Techniques such as mind mapping, geometric modeling, and data visualization empower students to break down complicated issues into manageable parts. Moreover, part of having a high math proficiency can be finding visual solutions to explain complex mathematical ideas. Communicating a problem’s solution can be as important as finding the right answer.
Prepare students for real-world problems
In a world where attention is often scrambled, effectively communicating complex ideas is essential. Across a wide range of professions, students might need to represent ideas that involve analytical thinking, math, and visual patterns. We can think about graphs in spreadsheets, data visualizations in business reports, architectural blueprints, and even infographics used in marketing campaigns.
Visual math enables clearer and more effective communication, allowing intricate data to be presented in an easily digestible and appealing manner. This not only aids in comprehension but also enhances the ability to persuade and inform diverse audiences, making visual math an invaluable tool in today’s data-driven world.
Introducing in your math course real-world applications that involve visual training is an excellent way to equip students with the skills they will across their academic and professional lives.

Tips to integrate visual mathematics into your class
Use visual examples
Visual representations can be an effective way to engage students and invite them to participate actively in your lessons. For example, you can complement your lectures with a video, infographic, or interactive visualization. Apart from being eye-catching, they can spark curiosity and encourage deeper mathematical thinking.
Ask students to find visual patterns
Subjects like statistics can feel particularly intimidating for some students. However, one way to help them understand data is to ask them to process it visually. Reading graphic representations can help students digest the content. Encouraging them to identify trends, correlations, and outliers within charts or graphs can make abstract concepts more tangible.
Debunk myths
There are plenty of myths that prevent people from letting their math skills flourish. For example, many students think they are not “math people”, hindering their performance and spreading negative attitudes and feelings about math. A way to combat these wrong conceptions is fostering a growth mindset, which focuses on rewarding practice and progress over thinking math skills are fixed. Here you can learn more about how to do it.
To debunk another myth: sophisticated mathematics does not need to be an incomprehensible mix of abstract symbols and letters. Far from common beliefs, renowned mathematicians also engage with mathematics in visual ways. There is nothing wrong with strategies like sketching to solve a problem.
Value and encourage different ways of thinking
Throughout their learning journey, students might have learned that there is one legitimate approach to mathematics. But there are many ways to reach the right solution. Analytical and precise thinking does not exclude openness and imagination.
Students have diverse needs and learning preferences. A playful and explorative process that involves exploring visualizations can be as effective as more traditional methods. For example, you can invite students to draw when they practice (when it makes sense).
Many students might think there is no room for creativity in mathematics. However, fostering new ways of thinking and experimentation might help students discover what works best for them.
How can you foster visual math learning with Sowiso?
Sowiso is an online learning and testing platform for higher education. We provide ready-made courses in a wide variety of STEM subjects, including linear algebra, basic math, calculus, basic statistics, and much more.
We know how hard it is for mathematics educators to engage their students and how abstract topics like differential equations can feel for many people. That’s why we pay much attention to the visual part of mathematics learning and teaching.
Interactive theory and visualizations
Our digital textbooks feature theory pages with color-coded text, drop-down menus explaining specific proofs in further detail, interactive GeoGebra visualizations, and worked-out examples.
Help students experiment with interactive visual exercises
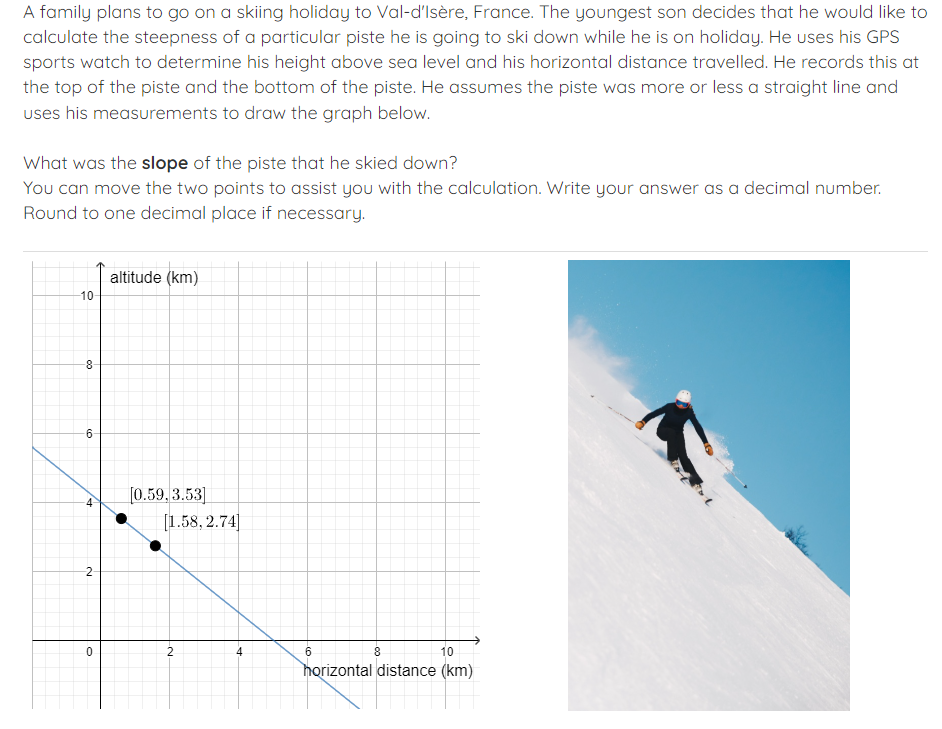
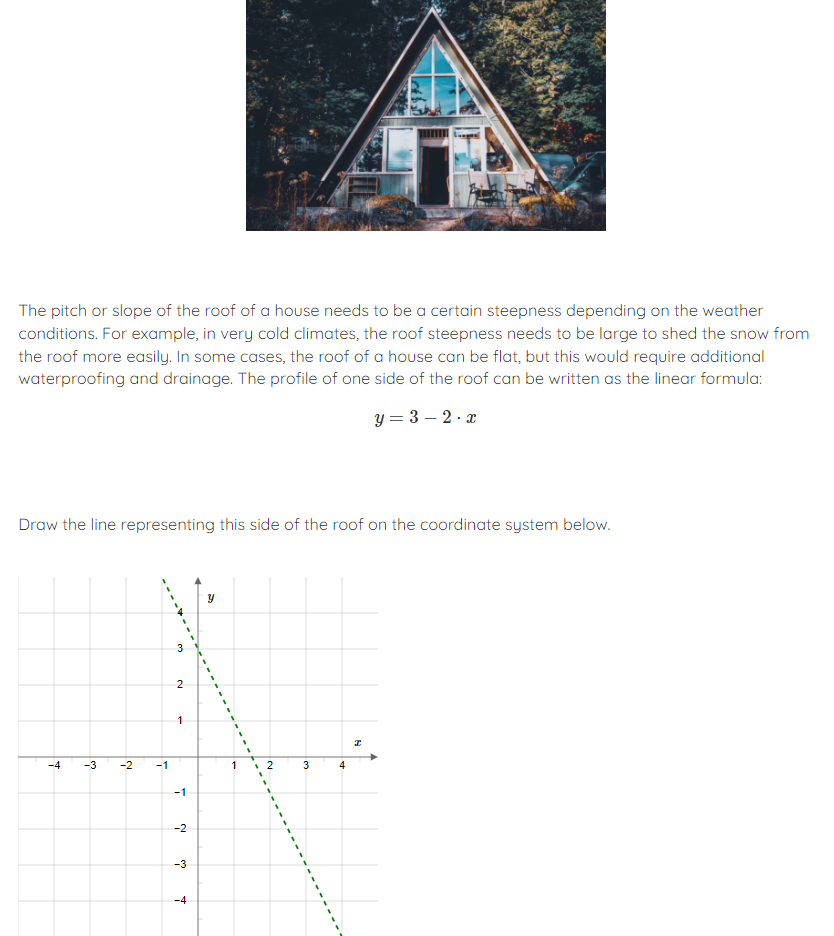
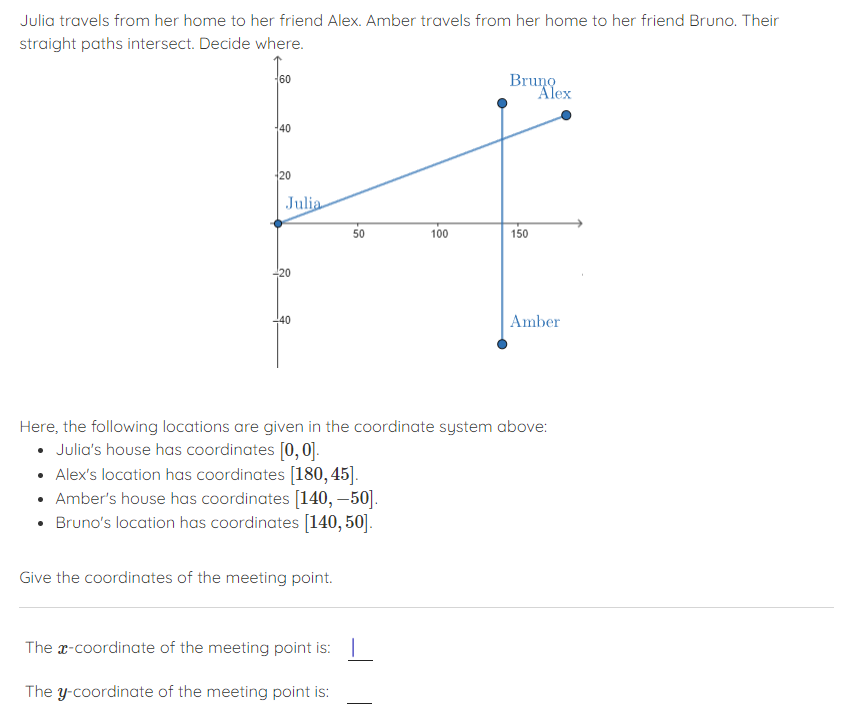
We have selected some of our exercises that make math more enjoyable while helping students actively process this content. These screenshots are from our Basic Math Applications (Science) course.

Create your own visual math exercises
If you want to create your own materials, you can design exercises and theory pages in Sowiso’s user-friendly platform. This option gives you the flexibility you need while and helps you speed up the content creation process.
Would you like to know more about how Sowiso facilitates visual math teaching and learning? Let us know, and we will be happy to help you!
references
- Stanford Report. (2024, May 15). The case for ‘math-Ish’ thinking. https://news.stanford.edu/stories/2024/05/the-case-for-math-ish-thinking
- Park, J., & Brannon, E. M. (2013). Training the approximate number system improves math proficiency. Psychological science, 24(10), 2013-2019.
Recommended readings

Math for non-math majors: Engaging students with real-world math
Discover how to use real-life math to engage students, plus a successful use case from Radboud University. This post sums up the takeaways from a webinar with OpenStax.

Interactive math learning: Tips to engage your math students
The power of interactive math learning: Tips to engage your students in your mathematics lessons

Adaptive Learning in Mathematics Education
Explore how adaptive learning in math provides tailored student journeys, enhancing engagement and mastery.


